Tutorial
n8n AI Assistant Tutorial: Self-Hosted Setup in 2026
Build an n8n AI assistant self hosted on a Mac mini with private access, durable memory, approvals, and failure alerts for reliable daily business use.
 Zeeshan AhmadApr 21, 2026
 Awais AhmadApr 10, 2026
A dependable tracker gives every task one owner, one current status, and one due date that can trigger a clear warning instead of disappearing in a long sheet.
In 2024, Atlassian found that 56% of surveyed knowledge workers said teams at their company planned and tracked work differently (Atlassian, State of Teams 2024). The same research found that 55% struggled to locate information and 50% discovered duplicated project work only after it had started.
<figure> <style> .c1 { ```text --surface: #fcfcfb; --ink-1: #0b0b0b; --ink-2: #52514e; --muted: #898781; --grid: #e1e0d9; --accent: #2a78d6; --accent-2: #1baf7a; --negative: #c05a3e; ``` font-family: system-ui, sans-serif; } @media (prefers-color-scheme: dark) { .c1 { ```text --surface: #1a1a19; --ink-1: #ffffff; --ink-2: #c3c2b7; --muted: #898781; --grid: #2c2c2a; --accent: #3987e5; --accent-2: #199e70; --negative: #d0674a; ``` } } .c1 .title { fill: var(--ink-1); font-size: 18px; font-weight: 700; } .c1 .subtitle { fill: var(--ink-2); font-size: 12px; } .c1 .label { fill: var(--ink-2); font-size: 13px; } .c1 .axis { fill: var(--muted); font-size: 11px; } .c1 .value { fill: var(--ink-1); font-size: 15px; font-weight: 700; } .c1 .takeaway { fill: var(--muted); font-size: 11px; } .c1 .grid { stroke: var(--grid); stroke-width: 1; } </style> <svg class='c1' viewBox='0 0 560 380' role='img' aria-label='Horizontal bar chart showing that 56 percent of surveyed knowledge workers said teams track work differently, 55 percent said information is hard to locate, and 50 percent discovered duplicate project work later.'> <rect x='0' y='0' width='560' height='380' fill='var(--surface)'/> <text class='title' x='28' y='34'>Task Visibility and Coordination Problems</text> <text class='subtitle' x='28' y='56'>Percent of surveyed knowledge workers</text> <line class='grid' x1='170' y1='82' x2='170' y2='302'/> <line class='grid' x1='273.3' y1='82' x2='273.3' y2='302'/> <line class='grid' x1='376.7' y1='82' x2='376.7' y2='302'/> <line class='grid' x1='480' y1='82' x2='480' y2='302'/> <text class='axis' x='170' y='320' text-anchor='middle'>0</text> <text class='axis' x='273.3' y='320' text-anchor='middle'>20</text> <text class='axis' x='376.7' y='320' text-anchor='middle'>40</text> <text class='axis' x='480' y='320' text-anchor='middle'>60%</text> <text class='label' x='160' y='112' text-anchor='end'><tspan x='160' dy='0'>Teams track work</tspan><tspan x='160' dy='15'>differently</tspan></text> <rect x='170' y='105' width='289.3' height='20' rx='5' fill='var(--accent)'/> <text class='value' x='467.3' y='121'>56%</text> <text class='label' x='160' y='182' text-anchor='end'><tspan x='160' dy='0'>Information is</tspan><tspan x='160' dy='15'>hard to locate</tspan></text> <rect x='170' y='175' width='284.2' height='20' rx='5' fill='var(--accent)'/> <text class='value' x='462.2' y='191'>55%</text> <text class='label' x='160' y='252' text-anchor='end'><tspan x='160' dy='0'>Duplicate work</tspan><tspan x='160' dy='15'>found later</tspan></text> <rect x='170' y='245' width='258.3' height='20' rx='5' fill='var(--accent)'/> <text class='value' x='436.3' y='261'>50%</text> <text class='takeaway' x='28' y='356'>Inconsistent methods, search friction, and duplicate work weaken task visibility.</text> </svg> <figcaption>Source: Atlassian, State of Teams 2024.</figcaption> </figure>What you will build: a working task table with controlled dropdowns, whole-row status colors, upcoming and overdue date alerts, completion counts, a completion percentage, future-row coverage, and an edge-case test plan. The setup fits into one focused working session when the source sheet is reasonably clean.
In a 2025 Newforma survey, centralized project information was associated with reported gains including 32% higher-quality outcomes and 30% improved profitability (Newforma, 2025 AECO Project and Information Management Survey). A spreadsheet will not solve every coordination problem, but it can provide a shared source of truth.
A task tracking template Google Sheets users can trust is worth building when unclear ownership, inconsistent statuses, and hidden due dates are causing work to be missed or repeated.
In 2025, Newforma reported that 77% of surveyed architecture, engineering, construction, and operations firms associated missed deadlines with poor access to current project information (Newforma, 2025 AECO Project and Information Management Survey). The same survey identified miscommunication as the primary cause of rework for 73% of respondents. The mechanism is familiar elsewhere: a task exists, ownership is unclear, and the sheet does not surface the risk early enough.
In 2026, Workday found that one in four surveyed UK professionals spent seven or more hours per week copying information, reconciling conflicting data, and moving context between applications (Workday, The Copy/Paste Economy research). A well-designed tracker reduces that friction by keeping the task, owner, state, and date logic in the same row.
<figure> <style> .c2 { ```text --surface: #fcfcfb; --ink-1: #0b0b0b; --ink-2: #52514e; --muted: #898781; --grid: #e1e0d9; --accent: #2a78d6; --accent-2: #1baf7a; --negative: #c05a3e; ``` font-family: system-ui, sans-serif; } @media (prefers-color-scheme: dark) { .c2 { ```text --surface: #1a1a19; --ink-1: #ffffff; --ink-2: #c3c2b7; --muted: #898781; --grid: #2c2c2a; --accent: #3987e5; --accent-2: #199e70; --negative: #d0674a; ``` } } .c2 .title { fill: var(--ink-1); font-size: 18px; font-weight: 700; } .c2 .subtitle { fill: var(--ink-2); font-size: 12px; } .c2 .label { fill: var(--ink-2); font-size: 13px; } .c2 .axis { fill: var(--muted); font-size: 11px; } .c2 .value { fill: var(--ink-1); font-size: 15px; font-weight: 700; } .c2 .takeaway { fill: var(--muted); font-size: 11px; } .c2 .grid { stroke: var(--grid); stroke-width: 1; } </style> <svg class='c2' viewBox='0 0 560 380' role='img' aria-label='Donut chart showing that 25 percent of surveyed UK professionals spend seven or more hours per week moving and reconciling information, while 75 percent spend less than seven hours.'> <rect x='0' y='0' width='560' height='380' fill='var(--surface)'/> <text class='title' x='28' y='34'>Weekly Time Lost to Manual Information Movement</text> <text class='subtitle' x='28' y='56'>Share of surveyed UK professionals</text> <circle cx='180' cy='205' r='100' fill='none' stroke='var(--grid)' stroke-width='40'/> <circle cx='180' cy='205' r='100' fill='none' stroke='var(--accent)' stroke-width='40' stroke-dasharray='157.1 628.3' stroke-dashoffset='0' transform='rotate(-90 180 205)'/> <circle cx='180' cy='205' r='100' fill='none' stroke='var(--grid)' stroke-width='40' stroke-dasharray='471.2 628.3' stroke-dashoffset='-157.1' transform='rotate(-90 180 205)'/> <text x='180' y='200' text-anchor='middle' fill='var(--ink-1)' font-size='30' font-weight='700'>25%</text> <text class='label' x='180' y='224' text-anchor='middle'>spend 7+ hours</text> <rect x='330' y='142' width='16' height='16' rx='3' fill='var(--accent)'/> <text class='label' x='358' y='155'>7+ hours each week</text> <text class='value' x='500' y='155' text-anchor='end'>25%</text> <rect x='330' y='196' width='16' height='16' rx='3' fill='var(--grid)'/> <text class='label' x='358' y='209'>Less than 7 hours</text> <text class='value' x='500' y='209' text-anchor='end'>75%</text> <text class='takeaway' x='28' y='356'>One in four respondents lost at least seven hours a week to information movement.</text> </svg> <figcaption>Source: Workday, The Copy/Paste Economy research, 2026.</figcaption> </figure>This tutorial focuses on what breaks after the first clean demo: drifting status values, text dates, overlapping rules, formulas that stop at the last populated row, and completed tasks that still appear overdue. You will test the sheet like a small software system rather than assume colored cells mean it works.
Key point: the tracker is dependable only when its inputs are controlled, its rules are mutually exclusive, and its behavior is verified against blank, invalid, current, past, and future dates.
You need an editable Google Sheet, desktop access, and enough familiarity with cell references to recognize a column letter and a row number.
<iframe width="560" height="315" src="https://www.youtube-nocookie.com/embed/ZAB1Qf_Ef5M" title="Task Management Tracker in Google Sheets | Step by Step tutorial" frameborder="0" allow="accelerometer; autoplay; clipboard-write; encrypted-media; gyroscope; picture-in-picture; web-share" allowfullscreen></iframe>Use a Google account that can edit the target file, not an account limited to view or comment access. Work in the desktop version of Google Sheets because the full conditional-formatting, data-validation, filter-view, and protection controls are easier to inspect there.
For an existing tracker, confirm that connected forms, scripts, or imports will not write into the copy unexpectedly. Duplicating a file does not isolate every external dependency.
You should be comfortable selecting a range such as A2:G, reading a formula such as =$D2="Completed", and opening a sidebar. The build is beginner-friendly, but repairing an older sheet takes longer when it contains merged cells, hidden columns, inconsistent date formats, or several overlapping formatting rules.
Plan for one focused build session and a separate review pass; a formula that works on one row can still fail on a new row or text date.
Locate the columns that currently hold the task name, owner, priority, status, start date, due date, and notes. Also identify formula columns, hidden helpers, protected ranges, filter views, and summary cells. Record the final column letters before writing rules.
This tracker will turn a plain task list into a controlled table that exposes ownership, status, urgency, and progress without requiring a separate project-management platform.
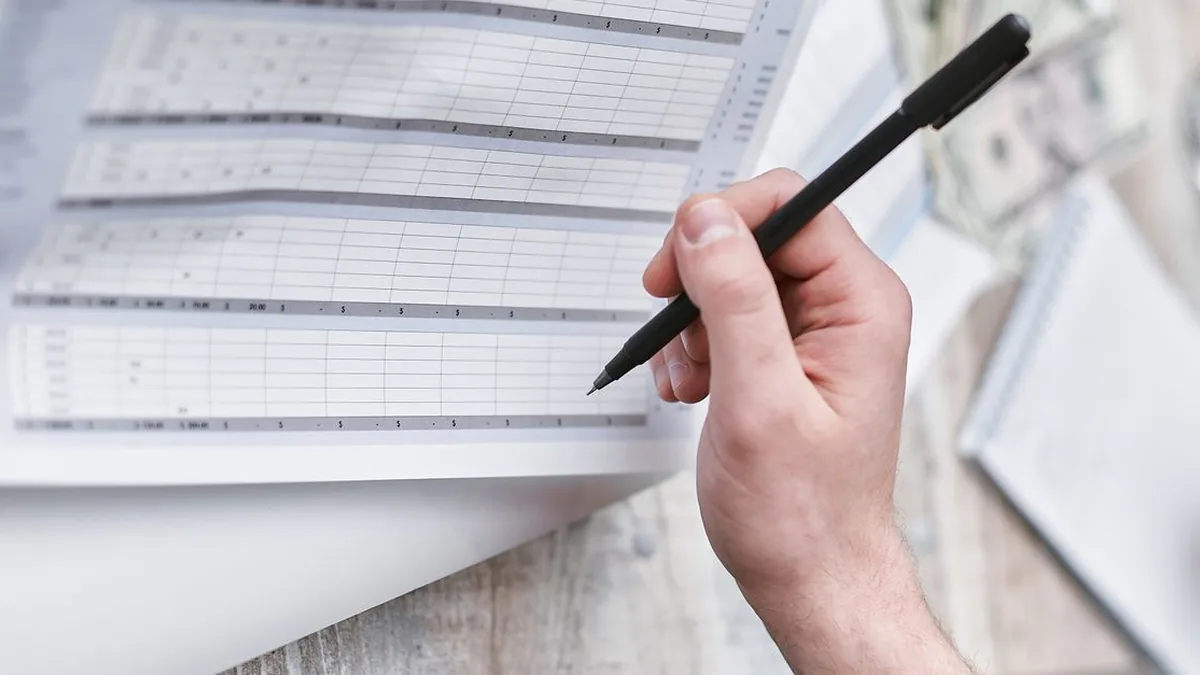
Photo by Mikhail Nilov on Pexels
Each task row will contain a task name, owner, priority, status, start date, due date, and notes. Status and priority will use controlled dropdowns. Conditional formatting will color the whole row by status, then add separate date warnings for upcoming, due-today, and overdue work. Summary formulas will count total, completed, open, and overdue tasks and calculate completion percentage.
The task table remains the source of truth while summary cells read from it, which is easier to audit than mixing manual totals with task records.
| Approach | What works well | Main limitation | Best fit |
|---|---|---|---|
| Static downloaded template | Quick visual starting point | Rules may not match your columns or survive new rows | A temporary personal list |
| Formula-driven Google Sheets tracker | Custom fields, visible formulas, controlled status logic | Requires testing and maintenance | Small teams with a clear process |
| Dedicated task platform | Dependencies, permissions, notifications, activity history | More setup and process change | Larger or more interconnected work |
A downloaded template gives you a layout; this tutorial gives you the rules that keep completed work from remaining visually overdue.
Prepare the sheet by duplicating it, confirming the real data range, and standardizing the columns before adding any formula or formatting rule.
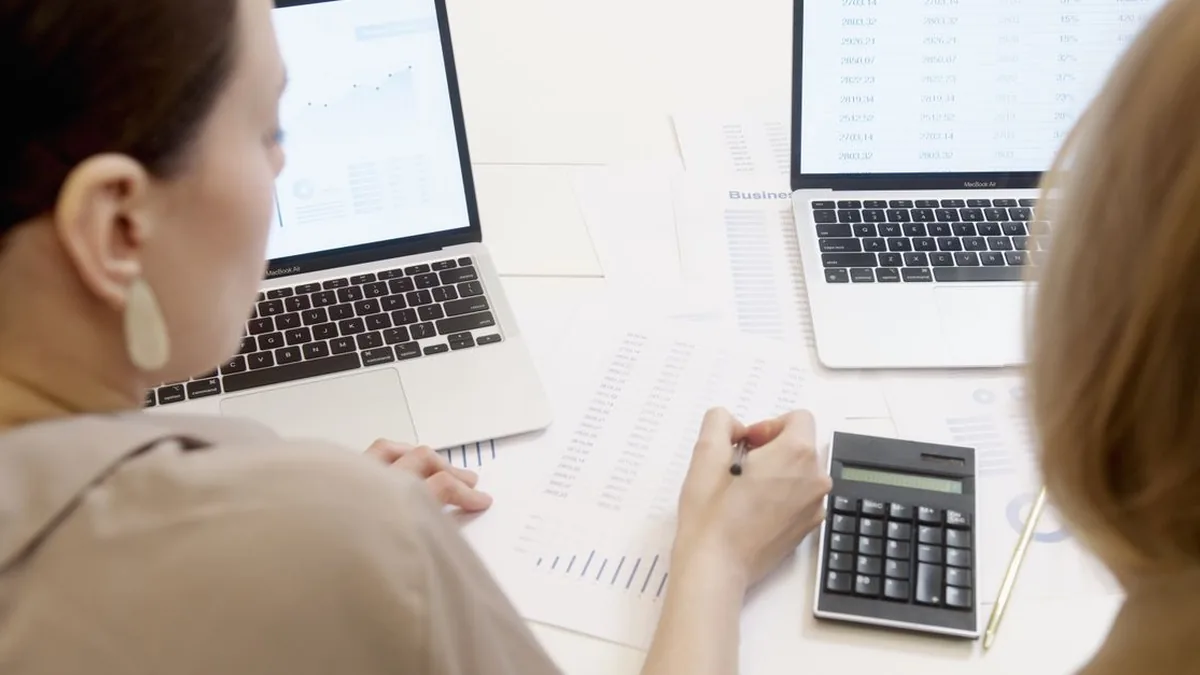
Photo by Artem Podrez on Pexels
Open File → Make a copy, rename the duplicate clearly, and keep the original unchanged until testing is complete. If the sheet imports data or uses Apps Script, check those connections separately because copied formulas and scripts may still point outside the file.
Freeze the header through View Freeze 1 row so column names stay visible while you test lower rows. Avoid putting titles, merged cells, or blank spacer rows inside the task table because filters and open-ended formulas work best with one header row followed immediately by records.
Choose one date format for the start and due-date columns through Format
Number
Date. Formatting does not convert text into a real date, so test a suspicious cell with =ISNUMBER(F2). A real Sheets date returns TRUE; imported text such as 2026-07-13 may still need conversion depending on the locale and import method.
Keep each column dedicated to one data type, and keep free-text notes out of the status column.
Merged cells inside the task range can break sorting. Mixed date formats can produce warnings on some rows but not others. A header included in the formatting range can turn red because the formula starts on the wrong row. Repair structure first, then inputs, formulas, formatting, and tests.
Set up the task tracking Google Sheets table with one header row and one record per row so sorting, filtering, validation, and formulas all operate on predictable data.

Photo by Ivan S on Pexels
Use this practical order:
| Column | Header | Purpose |
|---|---|---|
| A | Task | The work item in plain language |
| B | Owner | The person accountable for the next update |
| C | Priority | A controlled urgency level |
| D | Status | A controlled workflow state |
| E | Start Date | When work begins |
| F | Due Date | The date used by alert rules |
| G | Notes | Blockers, context, or a next action |
Keep one task per row. Split independently owned steps into separate rows rather than hiding a mini-project in one notes cell.
Format columns E and F as dates, then freeze the header. Enter representative completed, active, blocked, and undated tasks before building rules so broken references are visible.
Create a filter through Data → Create a filter, or use filter views when several people need different views without changing everyone else's sort order. Sort by due date and confirm the complete rows move together. If one column remains behind, expand the filter range.
Add dropdowns so every status and priority value is predictable enough for formulas and conditional formatting to match exactly.
Photo by Kampus Production on Pexels
Select D2:D, then choose Data
Data validation
Add rule. Under Criteria, choose Dropdown and add Not Started, In Progress, Blocked, and Completed. Google's dropdown documentation explains the current validation controls, including chip display and invalid-data handling.
Use an open-ended range so new rows inherit the validation. Keep the visible labels stable after formulas are built; changing Completed to Done later will break any rule that still checks for the old text.
Apply another dropdown to C2:C with values that reflect actual decisions, such as Low, Medium, High, and Critical. Use only levels the team can distinguish; priority should not replace status or due date.
Set invalid entries to be rejected when consistency matters more than free-form input. Then paste a misspelled value into a test row and confirm Sheets blocks it or warns according to the selected setting. Also test pasted data, which can introduce trailing spaces.
Color each task row with a custom formula that locks the status column while allowing the row number to change for every task.
Photo by Kindel Media on Pexels
Select A2:G, then choose Format → Conditional formatting. Under Format cells if, choose Custom formula is. Google's conditional-formatting guidance uses custom formulas for row-wide conditions where one cell controls formatting across a larger range.
Create one rule per status:
gs =$D2="Not Started" =$D2="In Progress" =$D2="Blocked" =$D2="Completed"
Use strong contrast for Blocked, a calm style for Completed, and lighter fills for ordinary states.
In =$D2="Completed", the dollar sign locks column D, while row 2 remains relative. When Sheets evaluates the next task row, the reference becomes D3, then D4, and so on. If you write =D$2="Completed", every row checks the same status cell. If you omit the dollar sign entirely, the checked column shifts as the rule applies across A:G.
The formula's first row must match the applied range: A2:G requires row 2.
Change one test row through every dropdown value. Confirm the whole row changes once, the header never changes, and blank rows remain unformatted. Then add a task below the existing data to confirm the open-ended range includes it.
Add mutually exclusive date rules that recognize real dates, ignore blank or text values, and skip rows already marked Completed.
Place the number of days in your upcoming window in a settings cell such as J2, then apply this rule to A2:G:
gs =AND(ISNUMBER($F2),$F2>TODAY(),$F2<=TODAY()+$J$2,$D2<>"Completed")
The TODAY function returns the current date without a time component. The rule requires a real future date inside the configured window and an incomplete status.
Use a separate rule for work due on the current date:
gs =AND(ISNUMBER($F2),$F2=TODAY(),$D2<>"Completed")
Keeping due-today separate gives it a stronger style and tests equality independently.
Use this rule for tasks whose due date has passed:
=AND(ISNUMBER($F2),$F2<TODAY(),$D2<>"Completed")
Do not replace ISNUMBER($F2) with only a blank check; text dates can still fail date arithmetic.
Test each condition directly: blank the due date, paste date-like text, use past, current, and future dates, then mark the row Completed. No old warning should remain.
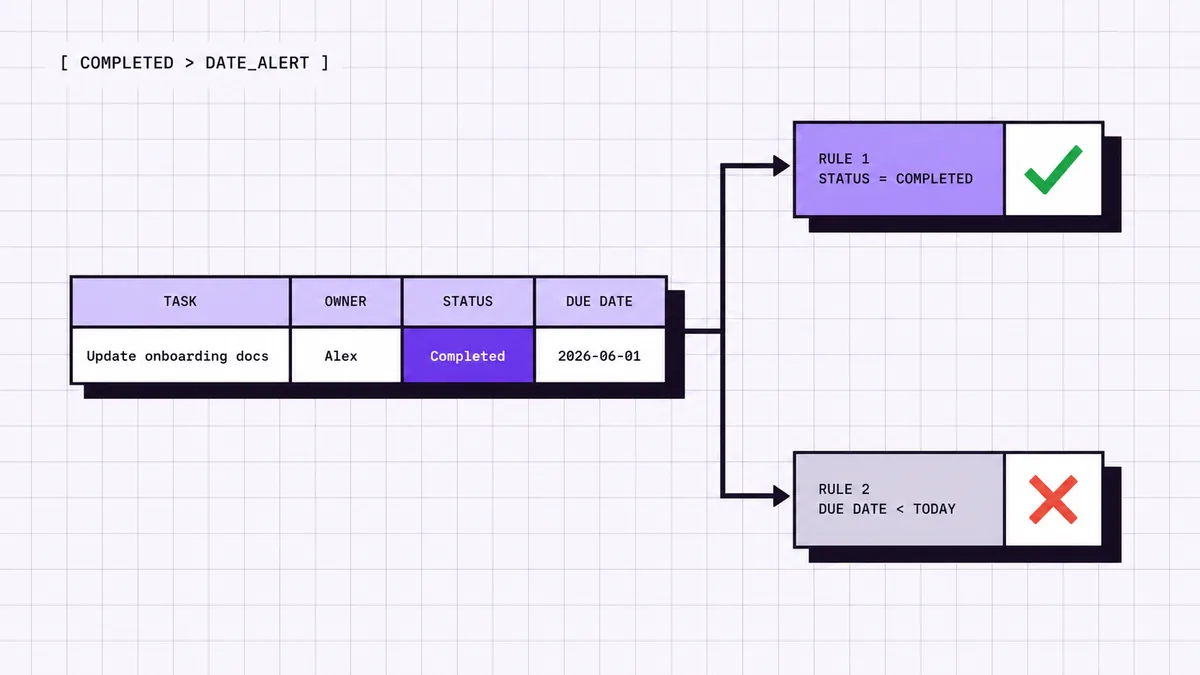
Completed status should override every date warning by being excluded from each date formula, not merely hidden by a preferred color.
Photo by Jakub Zerdzicki on Pexels
A completed task can also have a due date in the past, so both the Completed rule and the overdue rule may evaluate to true. Google Sheets can combine non-conflicting styles from several rules, which makes visual priority unreliable when one rule changes the fill and another changes text color or emphasis. Dragging a rule higher may appear to fix one case while leaving another style behind.
The dependable design is logical precedence: make conditions mutually exclusive so only the correct rule evaluates to true.
Keep $D2<>"Completed" inside every date formula. That single condition prevents upcoming, due-today, and overdue rules from matching a completed row. The Completed rule remains simple:
gs =$D2="Completed"
This is easier to reason about than relying on visual order. It also survives later style changes because correctness lives in the formulas rather than the sidebar arrangement.
Place the Completed status rule near the top for readability, followed by Blocked, overdue, due today, due soon, In Progress, and Not Started. Once formulas are exclusive, order mainly improves readability and future audits.
Run a conflict test: enter a due date before today, mark the task In Progress, confirm the overdue style appears, then mark it Completed and confirm the overdue style disappears entirely. Repeat with due today and upcoming dates.
Add summary formulas that read directly from the task table so totals change as soon as a task or status changes.
Photo by Negative Space on Pexels
Place summary labels outside the task range, then use:
gs =COUNTA(A2:A) =COUNTIF(D2:D,"Completed")
The first formula counts nonblank task names. The second uses COUNTIF to count rows with the exact Completed value. Counting the task-name column is safer than counting status because a newly entered task may not have a status yet.
Use COUNTIFS when several conditions must be true:
gs =COUNTIFS(A2:A,"<>",D2:D,"<>Completed") =COUNTIFS(A2:A,"<>",F2:F,"<"&TODAY(),D2:D,"<>Completed")

Automated Task Tracker Google Sheets adds status colors, date alerts, and dependable task visibility.
The open-task formula requires a task name and excludes Completed. The overdue formula adds a due-date comparison. This summary logic returns a count rather than a style.
Divide completed tasks by total tasks and protect the empty-sheet case with IFERROR:
gs =IFERROR(COUNTIF(D2:D,"Completed")/COUNTA(A2:A),0)
Format the result as a percentage. Change a known task to Completed and confirm the completed count, percentage, and row style change together. A mismatch means the rules read different ranges or labels.
Use open-ended validation and formatting ranges, then choose a controlled formula strategy so new tasks behave like existing ones without manual repairs.
Photo by Artem Podrez on Pexels
Apply status validation to D2:D, priority validation to C2:C, and formatting to A2:G rather than stopping at the current last row. Summary formulas should also use open-ended columns. This keeps ordinary row additions inside the system automatically.
Open-ended ranges can slow very large sheets. In that case, use a generous bounded range and review it during maintenance.
Use copied formulas when each row may need exceptions or manual overrides. Use ARRAYFORMULA for derived columns that should be generated consistently from a single formula. Keep the cells below an array formula empty, because any manual value in its expansion path causes an error.
Keep human inputs as normal cells and reserve array formulas for derived columns.
Protect summary and derived-formula cells through Data → Protect sheets and ranges. Google's protected-range guidance lets you restrict editing or warn users before changes. Protection does not replace access control, but it prevents accidental overwrites.
Test the tracker with deliberate edge cases before sharing it, because a clean-looking sample row does not prove that blank, invalid, current, past, and future inputs behave correctly.
Photo by Mikhail Nilov on Pexels
Create one temporary task and move it through every status. Confirm the dropdown accepts only valid values, each status color applies to the whole row, and the Completed state clears date warnings. Then remove the due date and confirm the row receives no date alert.
Next, insert a new row below the existing data. Verify the dropdowns appear, formatting evaluates, summary counts change, and any derived formula extends according to the chosen method.
| Test input | Expected result |
|---|---|
| Blank due date | No date alert |
| Date stored as text | No false alert; cell is flagged for cleanup |
| Due date before today, task open | Overdue style |
| Due date today, task open | Due-today style |
| Due date after today but inside the configured window | Due-soon style |
| Due date beyond the configured window | No date warning |
| Past due date, task Completed | Completed style only |
| New task added below existing records | Dropdowns, formatting, and counts still work |
Record the actual result. On failure, inspect range, row reference, status spelling, date type, and rule overlap in that order.
Confirm headers are frozen, filters include every task column, dates sort chronologically, protected cells cannot be overwritten accidentally, summary counts match a manual spot-check, and the working copy has a clear owner. Remove test rows only after the matrix passes, then share with minimum required permissions.
Audit ranges, references, data types, and duplicate rules before rebuilding the tracker, because most failures come from a small set of structural mistakes.
In 2009, Powell, Baker, and Lawson found errors in 0.8% to 1.8% of formula cells across 50 operational spreadsheets, depending on the error definition (Powell, Baker, and Lawson, Impact of Errors in Operational Spreadsheets). The study is older, but it remains useful evidence that spreadsheet errors are measurable rather than hypothetical.
<figure> <style> .c3 { ```text --surface: #fcfcfb; --ink-1: #0b0b0b; --ink-2: #52514e; --muted: #898781; --grid: #e1e0d9; --accent: #2a78d6; --accent-2: #1baf7a; --negative: #c05a3e; ``` font-family: system-ui, sans-serif; } @media (prefers-color-scheme: dark) { .c3 { ```text --surface: #1a1a19; --ink-1: #ffffff; --ink-2: #c3c2b7; --muted: #898781; --grid: #2c2c2a; --accent: #3987e5; --accent-2: #199e70; --negative: #d0674a; ``` } } .c3 .title { fill: var(--ink-1); font-size: 18px; font-weight: 700; } .c3 .subtitle { fill: var(--ink-2); font-size: 12px; } .c3 .label { fill: var(--ink-2); font-size: 13px; } .c3 .axis { fill: var(--muted); font-size: 11px; } .c3 .value { fill: var(--ink-1); font-size: 15px; font-weight: 700; } .c3 .takeaway { fill: var(--muted); font-size: 11px; } .c3 .grid { stroke: var(--grid); stroke-width: 1; } </style> <svg class='c3' viewBox='0 0 560 380' role='img' aria-label='Vertical bar chart showing an observed formula-cell error range from 0.8 percent at the lower estimate to 1.8 percent at the upper estimate.'> <rect x='0' y='0' width='560' height='380' fill='var(--surface)'/> <text class='title' x='28' y='34'>Observed Formula-Cell Error Range</text> <text class='subtitle' x='28' y='56'>Percent of formula cells across 50 operational spreadsheets</text> <line class='grid' x1='70' y1='320' x2='520' y2='320'/> <line class='grid' x1='70' y1='260' x2='520' y2='260'/> <line class='grid' x1='70' y1='200' x2='520' y2='200'/> <line class='grid' x1='70' y1='140' x2='520' y2='140'/> <line class='grid' x1='70' y1='80' x2='520' y2='80'/> <text class='axis' x='58' y='324' text-anchor='end'>0</text> <text class='axis' x='58' y='264' text-anchor='end'>0.5</text> <text class='axis' x='58' y='204' text-anchor='end'>1.0</text> <text class='axis' x='58' y='144' text-anchor='end'>1.5</text> <text class='axis' x='58' y='84' text-anchor='end'>2.0%</text> <rect x='145' y='224' width='110' height='96' rx='6' fill='var(--negative)' opacity='0.68'/> <text class='value' x='200' y='214' text-anchor='middle'>0.8%</text> <text class='label' x='200' y='344' text-anchor='middle'>Lower estimate</text> <rect x='335' y='104' width='110' height='216' rx='6' fill='var(--negative)'/> <text class='value' x='390' y='94' text-anchor='middle'>1.8%</text> <text class='label' x='390' y='344' text-anchor='middle'>Upper estimate</text> <text class='takeaway' x='28' y='370'>Small error rates still matter when trackers contain many copied formulas.</text> </svg> <figcaption>Source: Powell, Baker, and Lawson, Impact of Errors in Operational Spreadsheets, 2009.</figcaption> </figure>Start with the visible symptom, then trace which rule or formula owns it. Open the conditional-formatting sidebar and note every applied range and custom formula. Search for rules that target the same rows, formulas whose first row does not match the range, and status text that no longer matches the dropdown.
In 2018, the ExceLint research tool analyzed a corpus of 70 spreadsheets in a median of five seconds per file (Barowy, Berger, and Zorn, ExceLint). The result supports systematic checks over random visual scanning.
| Problem | Typical symptom | Fix |
|---|---|---|
| Formatting starts on the wrong row | Headers change color or task colors are shifted | Match the formula's first row to the applied range's first row |
| Missing locked column | Different cells across the row control the format | Use $D2, not D2, when status is in column D |
| Date stored as text | A visible date does not trigger a warning | Confirm with ISNUMBER, then convert or re-enter the value as a real date |
| Dropdown value changed | Completed rows stop matching formulas | Update validation and every dependent formula together |
| Duplicate formatting rules | Rows show mixed or unexpected styles | Remove redundant rules and make conditions mutually exclusive |
| Formula stops at old last row | New tasks are missing counts or flags | Use an open-ended range or extend the bounded range deliberately |
| ARRAYFORMULA cannot expand | The formula reports an expansion error | Clear manual values from the destination cells |
| Summary count includes empty work | Totals are higher than visible tasks | Count the task-name column and require nonblank tasks in COUNTIFS |
| Circular reference | A summary or helper formula errors immediately | Move the formula outside the range it reads or remove self-reference |
| Formula overwritten | One row behaves differently from its neighbors | Restore from the working copy, then protect the formula range |
Change one reference or rule at a time, then rerun the failing test.
Add a small dashboard, selective reminders, or a dedicated task platform only when each addition removes a known coordination problem.
In 2026, Workday found that 78% of surveyed UK professionals using AI at work were hindered by administrative tasks, while more than 60% reported busy but unproductive days often or very often (Workday, The Copy/Paste Economy research). Automation is useful when it removes repeated reconciliation, not when it adds another place to check.
Build charts from the existing summary cells rather than creating a second manual dataset. A status breakdown and overdue count are usually enough to answer whether work is moving and where attention is required.
<figure> <style> .c4 { ```text --surface: #fcfcfb; --ink-1: #0b0b0b; --ink-2: #52514e; --muted: #898781; --grid: #e1e0d9; --accent: #2a78d6; --accent-2: #1baf7a; --negative: #c05a3e; ``` font-family: system-ui, sans-serif; } @media (prefers-color-scheme: dark) { .c4 { ```text --surface: #1a1a19; --ink-1: #ffffff; --ink-2: #c3c2b7; --muted: #898781; --grid: #2c2c2a; --accent: #3987e5; --accent-2: #199e70; --negative: #d0674a; ``` } } .c4 .title { fill: var(--ink-1); font-size: 18px; font-weight: 700; } .c4 .subtitle { fill: var(--ink-2); font-size: 12px; } .c4 .label { fill: var(--ink-2); font-size: 13px; } .c4 .axis { fill: var(--muted); font-size: 11px; } .c4 .value { fill: var(--ink-1); font-size: 15px; font-weight: 700; } .c4 .takeaway { fill: var(--muted); font-size: 11px; } .c4 .grid { stroke: var(--grid); stroke-width: 1; } </style> <svg class='c4' viewBox='0 0 560 380' role='img' aria-label='Lollipop chart showing reported benefits of centralized project information: 32 percent higher quality outcomes, 30 percent improved profitability, 29 percent better employee wellbeing, 27 percent capacity for more projects, and 26 percent reduced litigation risk.'> <rect x='0' y='0' width='560' height='380' fill='var(--surface)'/> <text class='title' x='28' y='34'>Benefits of Centralized Project Information</text> <text class='subtitle' x='28' y='56'>Percent of surveyed AECO firms reporting each benefit</text> <line class='grid' x1='190' y1='82' x2='190' y2='326'/> <line class='grid' x1='190' y1='326' x2='500' y2='326'/> <text class='axis' x='190' y='344' text-anchor='middle'>0</text> <text class='axis' x='278.6' y='344' text-anchor='middle'>10</text> <text class='axis' x='367.1' y='344' text-anchor='middle'>20</text> <text class='axis' x='455.7' y='344' text-anchor='middle'>30%</text> <text class='label' x='180' y='109' text-anchor='end'>Higher quality</text> <line x1='190' y1='105' x2='473.4' y2='105' stroke='var(--accent-2)' stroke-width='3' stroke-linecap='round'/> <circle cx='473.4' cy='105' r='7' fill='var(--accent-2)'/> <text class='value' x='487.4' y='110'>32%</text> <text class='label' x='180' y='159' text-anchor='end'>Better profitability</text> <line x1='190' y1='155' x2='455.7' y2='155' stroke='var(--accent-2)' stroke-width='3' stroke-linecap='round'/> <circle cx='455.7' cy='155' r='7' fill='var(--accent-2)'/> <text class='value' x='469.7' y='160'>30%</text> <text class='label' x='180' y='209' text-anchor='end'>Better wellbeing</text> <line x1='190' y1='205' x2='446.9' y2='205' stroke='var(--accent-2)' stroke-width='3' stroke-linecap='round'/> <circle cx='446.9' cy='205' r='7' fill='var(--accent-2)'/> <text class='value' x='460.9' y='210'>29%</text> <text class='label' x='180' y='259' text-anchor='end'>More project capacity</text> <line x1='190' y1='255' x2='429.1' y2='255' stroke='var(--accent-2)' stroke-width='3' stroke-linecap='round'/> <circle cx='429.1' cy='255' r='7' fill='var(--accent-2)'/> <text class='value' x='443.1' y='260'>27%</text> <text class='label' x='180' y='309' text-anchor='end'>Lower litigation risk</text> <line x1='190' y1='305' x2='420.3' y2='305' stroke='var(--accent-2)' stroke-width='3' stroke-linecap='round'/> <circle cx='420.3' cy='305' r='7' fill='var(--accent-2)'/> <text class='value' x='434.3' y='310'>26%</text> <text class='takeaway' x='28' y='370'>Reported gains span quality, profitability, wellbeing, capacity, and risk reduction.</text> </svg> <figcaption>Source: Newforma, 2025 AECO Project and Information Management Survey.</figcaption> </figure>In 2025, Newforma reported benefits associated with centralized project information, including 32% higher-quality outcomes, 30% improved profitability, 29% better wellbeing, 27% capacity for more projects, and 26% lower litigation risk (Newforma, 2025 AECO Project and Information Management Survey). Treat those figures as industry-specific results, not a promise from adding a chart.
Send reminders only for conditions that require action, such as a blocked task with an approaching due date. In 2025, Microsoft reported that high-volume Microsoft 365 users received an average of 275 meeting, email, or chat interruptions per day (Microsoft Work Trend Index, Breaking Down the Infinite Workday). A reminder for every status change can make the tracker harder to use.
Move to a dedicated platform when dependencies, approvals, granular permissions, audit history, or cross-project reporting become central requirements. Sheets fits tabular work with shared states; it becomes fragile when many editors need different rules and automated actions.
These answers cover a clean sheet, an existing sheet, and a beginner build.
Create a task tracker by building one row per task with columns for owner, priority, status, start date, due date, and notes. Add controlled dropdowns, whole-row conditional formatting, date-alert formulas, and summary counts, then test blank dates, text dates, overdue completed tasks, and newly added rows before sharing.
Create task tracker in Google Sheets from an existing file by auditing the current columns and rules before adding anything. Make a working copy, standardize status and date inputs, repair broken ranges and references, then add mutually exclusive status and date formulas so old data remains intact.
Make a task tracker in Google Sheets by starting with a simple table and adding one feature at a time. Build the columns first, add status and priority dropdowns, apply status colors, add due-date warnings, calculate progress, extend the logic to future rows, and finish with the edge-case test matrix.
A dependable tracker is not defined by how polished it looks; it is defined by whether controlled inputs, date logic, summary formulas, protected cells, and new-row behavior remain correct under ordinary use.
The finished google sheets task tracking template should expose ownership, blocked work, due-date risk, and progress without manual row-by-row inspection. Rerun the test matrix whenever columns, labels, imports, or formulas change.
When an existing tracker has broken formulas, conflicting colors, unreliable date alerts, or rules that stop on new rows, Google Sheets task tracking template support from CogWorkLabs provides a practical next step for repairing and extending the system.
